


When you have a database infrastructure in place, you will still need to keep up with what is going on. There are several things you need to monitor. Some might vary depending on the version, vendor, or engine you are using. In this AppOptics APM blog you can find a guide to database monitoring, and in this article, we’ll be taking a look at the things to consider with monitoring.
What You Need to Monitor
If you are looking at a node or database cluster, there are a couple of things that are essential to keep an eye on. Those include the database and operating system. Consider the metrics you will use to keep an eye on things from both sides and know how you will do so. It is critical to do that in the context of the system. See if the behavior pattern changes, and in many times, you’ll need to use more than one tool since a single one is unlikely to cover the needed metrics.
Remember, if just one metric is affected, it can throw everything out of whack. Create a good alert system so you can make the job easier. When doing database monitoring, keep an eye on the CPU usage. If the CPU percentage is too high, there might be an issue indicating that something isn’t right. Look at the processes that might be causing the issue. If the database process is problematic, you’ll need to evaluate it. You’ll also want to check up on the operating system regularly. That might include looking at the SWAP usage or RAM memory. If the metric has a high value, but there are no system changes, you might need to look at the database configuration. Check work_mem and shared_buffers to look at how much memory the PostgreSQL database is using.
Look at the load average as well. If the load average is high, the CPU, disk, or RAM usage might be too high. Disk problems are essential to watch out for. If the disk usage increases too quickly, there may be errors in the PostgreSQL log file. In the same way, having high disk access consumption might point to a poor cache configuration. It might cause disk consumption instead of having memory process each query. Finally, you’ll want to look out for network problems. They might affect every system involved since your applications cannot connect to your database. Look for packet loss or latency. The main problem might be network saturation, poor network configurations, or hardware issues.
About PostgreSQL Databases
Monitoring is essential when it comes to finding potential issues, but that’s not the only reason to consider using it. With PostgreSQL monitoring, it also lets you know if there is anything you can do to improve the performance of the database. There are a few metrics to keep an eye on. It’s essential to keep an eye on the active sessions. If you are approaching the limit, check to see if you have to increment the max_connections value or if there is an issue. The number of connections might be increasing or decreasing. Common issues include locking, poor connection pooling, or network problems.
Query monitoring is one of them. PostgreSQL was configured to be stable and compatible with many applications, so you need to be able to configure your databases when you think about how much traffic there is. Use the EXPLAIN command for certain queries. Just try not to use too many queries at once since that might be too much for the systems to handle. You will also want to keep an eye on monitoring replication. When looking at this aspect, consider the replication state and the lag. If you have problems, they might be related to hardware resources or the network. If there is a replication issue, it is critical to know that immediately. You will have to solve the issue to ensure the environment is available.
Regularly check the database logs to look for errors, including deadlock. More common problems, such as long queries or authentication issues, can also be problematic. Look in the log file for the errors and learn how to fix them. Preventing data loss is a basic step, so know when your backups are done and ensure that they happen. You’ll also want to check it to see if you can use it. Too many people do not check whether they can use the data they backed up.
What to Look for in Your Tools
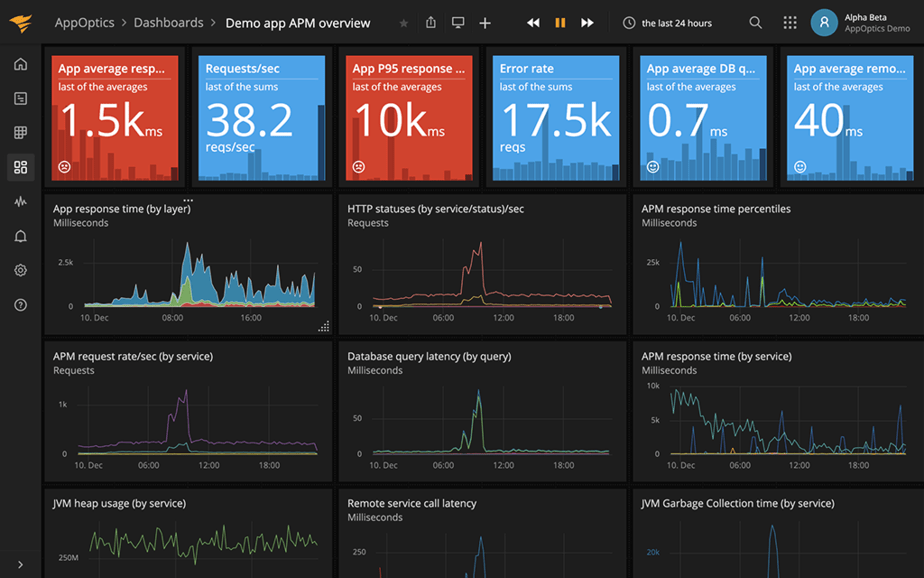
Even though monitoring is so critical, it often costs money, especially if you are looking at many aspects. That’s why you’ll want to stick with checking things that you use. Because of how critical visibility is for finding issues, you’ll need the tool to be visible. Having a dashboard might make the difference of finding an issue now or in a few minutes, and that time could be critical. Any tool should have a high level of visibility.
You’ll also want to choose a system that sends you an alert when there is a problem. Otherwise, you would have to go to the tool to check on things, and that could prevent you from finding an issue in time. You could get texts, emails, or other types of alerts. Don’t be afraid to use multiple tools to be able to check on each aspect. You may need to make some scripting changes as well. Look at the features of each tool you are considering in order to make sure you get the ones you need.