Businesses operating in today’s fast-paced digital landscape need data to make informed decisions. ServiceNow and Tableau are two powerful tools that can help organizations streamline their operations while gaining valuable insights from data simultaneously. However, using these tools separately can lead to time-consuming and error-prone manual data transfers. Fortunately, a ServiceNow Tableau integration solves this problem. In this post, we will walk through the steps of connecting these two platforms using the Tableau ServiceNow Connector so you can analyze and visualize your ServiceNow data in Tableau quickly and seamlessly.
Overview of Tableau and ServiceNow
Tableau is one of the most powerful tools for data visualization and exploration. This business intelligence solution simplifies creating interactive reports and dashboards from business data. Tableau helps users answer essential questions from their data and unlock hidden insights. Users can quickly visualize any data with ease by depicting data in visually appealing forms such as charts, graphs, trends, and plots. Tableau uses a drag-and-drop interface to combine databases and visualize data without complex scripting.
ServiceNow is a platform designed to manage IT services and streamline related processes. It offers automation capabilities to help organizations optimize their IT service management. The primary purpose of this solution is to serve as a cloud-based ticketing tool that enables the tracking of IT incidents and changes. ServiceNow has the potential to handle both hardware and software assets, as well as HR processes. It can also optimize business operations by implementing automated workflows.
The ServiceNow platform integrates seamlessly with several other business tools. One of the ways to maximize the platform’s features is to integrate ServiceNow with Tableau. Businesses that incorporate both platforms can leverage the strengths of the two platforms and open up the full potential of their data.
When to Use ServiceNow Tableau Integration: Use Cases
The main reason to integrate ServiceNow with Tableau is to view better IT incidents and track their impact on business. Tableau ServiceNow integration increases visibility so companies can track everything happening in their data environment. Utilizing Tableau’s data visualization capabilities enables the identification of potential issues that may be concealed within ServiceNow data, thereby preventing any negative impact on business outcomes. A comprehensive understanding of ServiceNow data can aid in recognizing fresh prospects and strategizing future undertakings with greater efficiency.
ServiceNow has inbuilt data analytics features, which are rudimentary compared to the capabilities of an advanced business intelligence solution like Tableau. Since the platform tends to generate large amounts of data, managing ServiceNow data can be overwhelming, especially without robust analytical solutions. Companies may need help exporting and consolidating the correct datasets for further complex analysis. Integrating Tableau with ServiceNow offers advanced data manipulation features. This integration empowers users to analyze a vast array of datasets comprising multiple tables and to merge ServiceNow data with other sources, thereby facilitating deeper analysis.
Tableau’s advanced reporting capabilities allow users to generate informative dashboards, custom reports, and charts helpful in various use cases. A ServiceNow Tableau integration makes it possible to gain deep insights from data. Some of the potential use cases of a ServiceNow Tableau Integration include:
IT Service Management
ITSM is one of the primary uses of ServiceNow. Integrating the platform with the data visualization features of Tableau makes it easier for users to gain insights into their IT service performance. Tableau ServiceNow integration allows you to track such metrics as an incidence resolution time, response time, and customer satisfaction rating necessary to optimize service delivery, improve process efficiency and boost overall customer satisfaction.
Customer Service Management
Tableau integration with ServiceNow can be helpful for customer service management by providing a comprehensive view of related customer interaction data. By analyzing customer satisfaction ratings, response time to customer inquiries, resolution time for customer issues, customer feedback, and sentiment analysis, Tableau’s number of customer complaints uncovers valuable knowledge and identifies areas needing improvement. It can lead to improved service quality and drive long-term customer loyalty.
Human Resources Management
ServiceNow can manage various HR workflows, including leave management, employee document management, performance management, etc. ServiceNow integration with Tableau will enable companies to analyze different HR data, such as employee performance ratings, goal achievements, and performance trends over time. Tableau visualizations of this ServiceNow data identify patterns and trends, and make more reasoned conclusions about talent management, resource allocation, and strategic workforce planning, ultimately improving HR processes and driving employee engagement.
Project Management
When you connect Tableau to ServiceNow in a project management context, you can analyze various data to acquire helpful perspicuity. It includes project timelines, milestones, task assignments, resource utilization, and budgetary information. The knowledge you gain from visualizing your project data this way can improve efficiency, reduce cost, improve project outcomes, and enhance overall project management effectiveness.
Why Use Tableau Connector for ServiceNow
The Alpha Serve’s Tableau Connector for ServiceNow is an Enterprise-grade plugin that simplifies connecting Tableau to ServiceNow. You can export data tables and fields from ServiceNow to Tableau without writing complex codes or scripts.
Tableau Connector for ServiceNow allows you to export and explore ServiceNow data with rich Tableau visuals in just minutes. With easy integration, complete customizability, and automated data updates, the connector helps to save time and improves the efficiency of data exports. The following are some of the features of the Tableau Connector for ServiceNow.
No-Code Integration
Thanks to its no-code integration capabilities, the connector simplifies ServiceNow Tableau Integration so you can quickly export data to the BI tool. Setting up the connector requires no additional technical experience, so you can start analyzing data swiftly with Tableau’s power.
Intuitive Interface
Tableau Connector for ServiceNow has an intuitive interface that’s easy for anyone to use. Business users without technical expertise can connect ServiceNow with Tableau and start visualizing data without stress.
Customized Reports
With the Tableau Connector for ServiceNow, you can customize your data export for further data visualization in Tableau to meet your reporting and business needs. This powerful integration enables you to harness the full potential of your ServiceNow data, generate personalized reports that cater to both analytical and business needs.
Automated Updates
Once you schedule data refresh, the connector automatically exports newly updated ServiceNow data to Tableau. It eliminates the need to update data manually and keeps the reports generated from the data accurate at all times.
Controlled Data Security
The connector is developed to comply with ServiceNow’s security and governance policies, ensuring that data is accessed and used securely. Administrators can set privileges and user roles. This grants access to only authorized users, simplifying management and security.
How to Connect Tableau to ServiceNow
Only users with a system admin role can install the Tableau Connector for ServiceNow and set up the integration between the two platforms. The connector is installed as a standalone app compatible with all modern browsers. Here’s a step-by-step guide for connecting Tableau to ServiceNow.
Step 1: Install the Tableau ServiceNow Connector
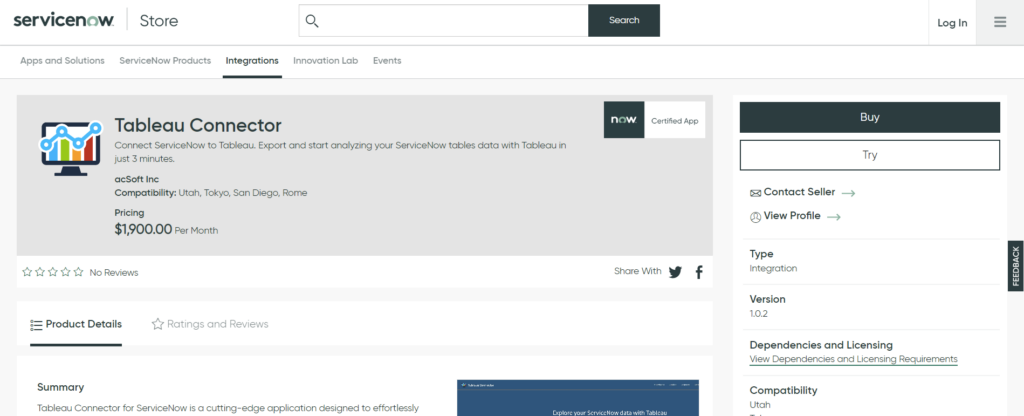
You can download the Tableau Connector for ServiceNow directly from the ServiceNow Store app product page. Click the Try button. You will be prompted to sign in with your HI credentials. Accept the Terms of Use and then click Try. Once accepted, the connector can be immediately installed on any sub-production instance.
Navigate to System Applications, proceed to All Available Applications, and select All. From there, locate the Tableau Connector for ServiceNow application. Upon finding it, initiate the installation process by clicking the Install button. Once the installation is complete, the Tableau Connector for ServiceNow will be available for use on your sub-production instance and accessed via the menu.
Step 2: Create a Data Source
The next step is to create a Data Source. Consider that access to the Tableau Connector for ServiceNow requires TABLEAU ADMIN or TABLEAU EDITOR roles assigned by the ServiceNow System Admin. If you do not have access, please get in touch with your System Admin and request to be set for any of the following roles.
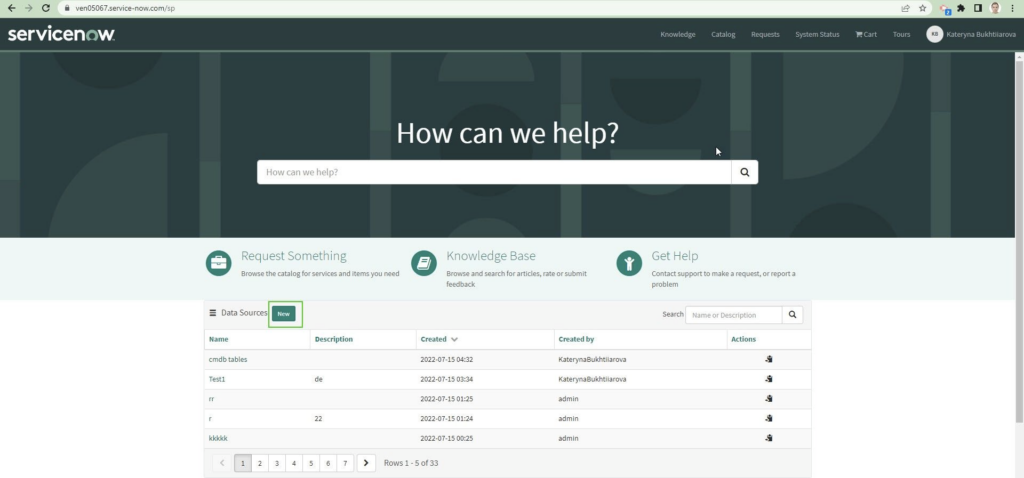
From the Service Portal Instance-Name.service-now.com/sp, locate the Data Sources table and Click the New button to create a new Data Source.
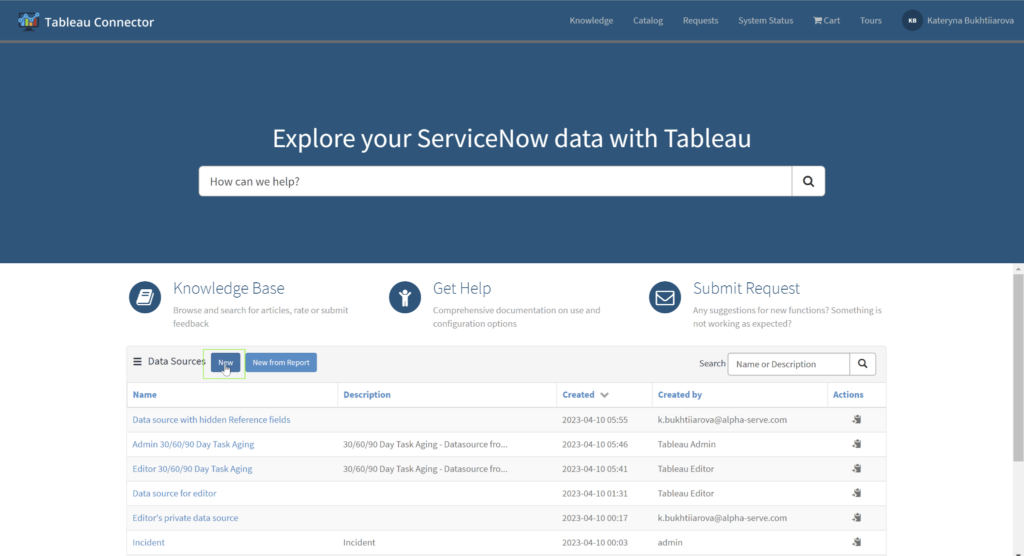
You can also create a new Data Source from the Tableau Connector page Instance-Name.service-now.com/tableau_connector
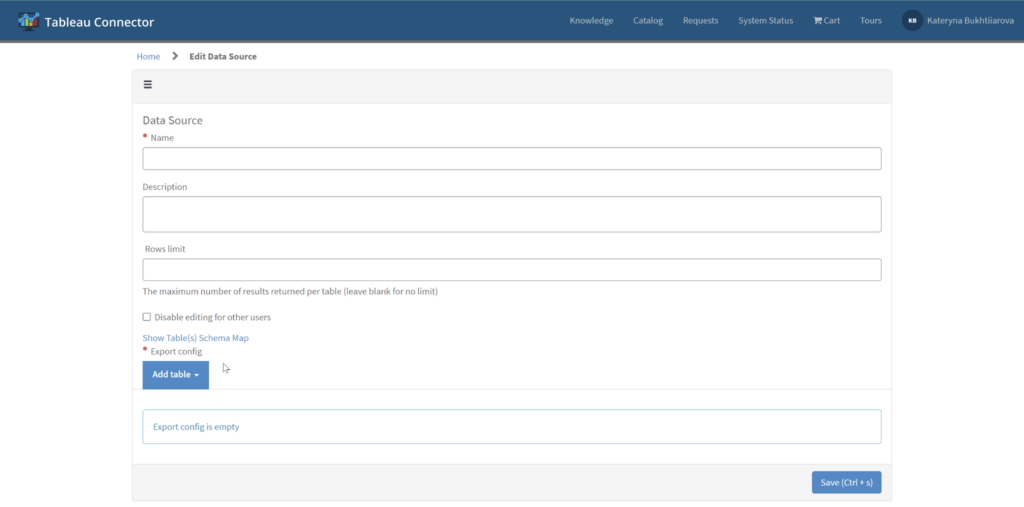
Input a descriptive and short name in the Data Source name field. An optional Description field is also available for additional details about the Data Source. Set a Rows limit for the number of rows to be imported into Tableau. By default, this field is blank, meaning data will be exported without any limitation. Besides, you can Disable editing for other users, which restricts Data Source editing for anyone who is not the creator or a ServiceNow Admin.
To add tables, click the Add Table button and type the table name in the search field. Alternatively, scrolling down can also find the table from the list. After selecting the table, click the Add button.
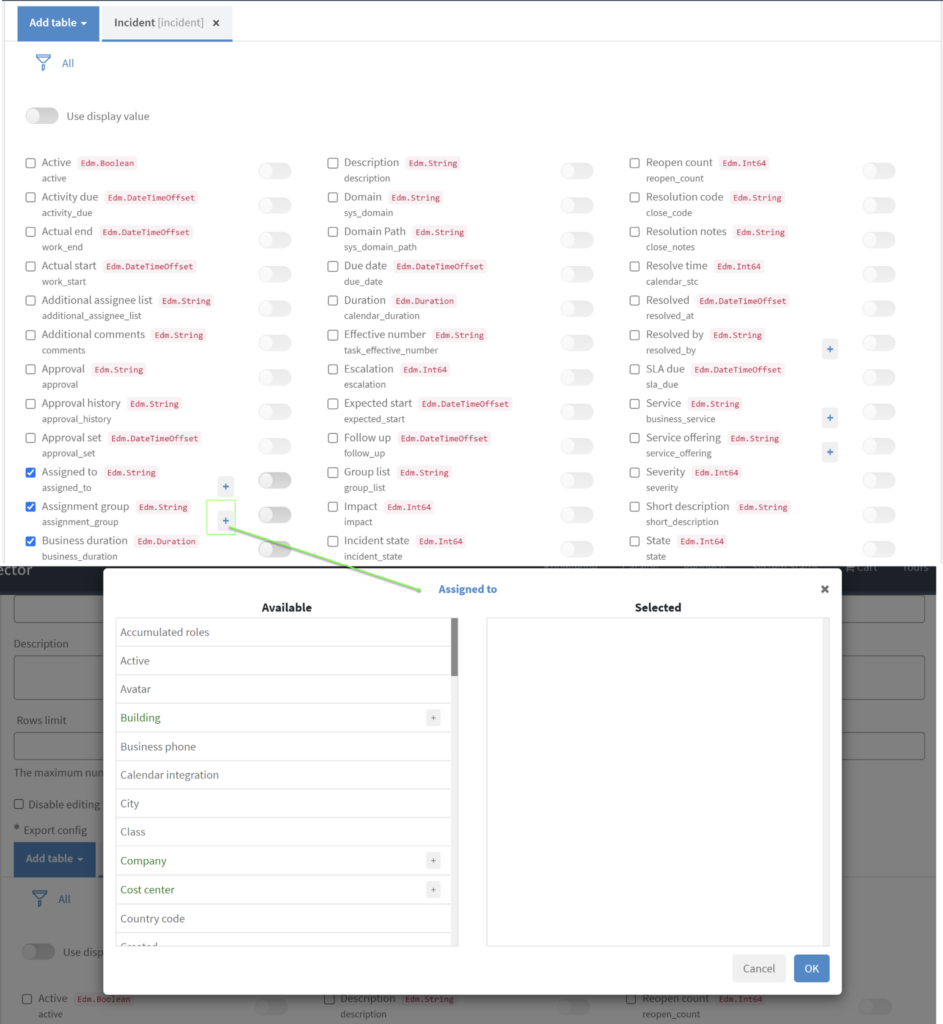
Please note, by default, no fields are selected and no filters are applied. After table inclusion, it is necessary to select the appropriate fields for the reports. If you need to export data in String format, please ensure the Use display value setting is activated.
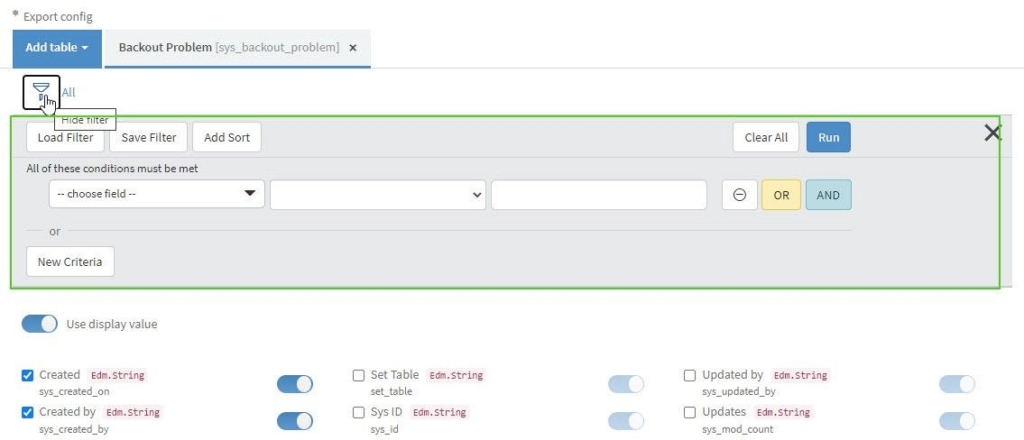
To enhance your export results precision, you can apply filters to your tables. Begin by selecting the Filter icon to set up the desired conditions. Once these conditions are in place, execute the filter by clicking the Run button.
For tables with Reference type fields, select the “+” icon and choose the referenced fields to export from the dialog box. Click OK to close.
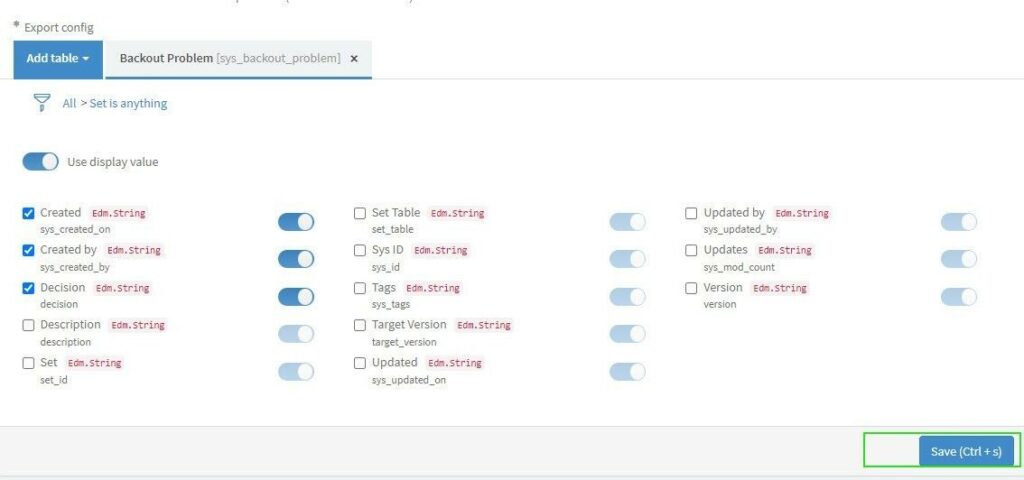
Click “Save” when you’re done with this setup of Data Source.
Step 3: Import ServiceNow Data into Tableau
The final step is to import the ServiceNow data into Tableau.
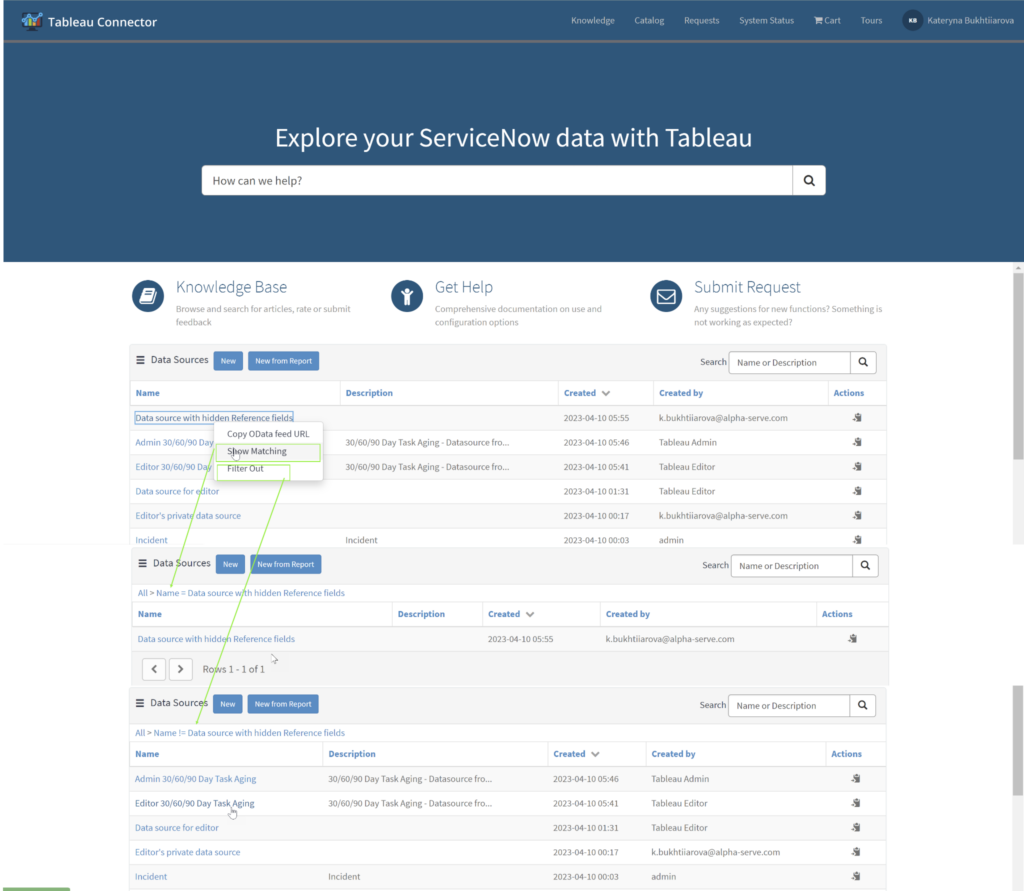
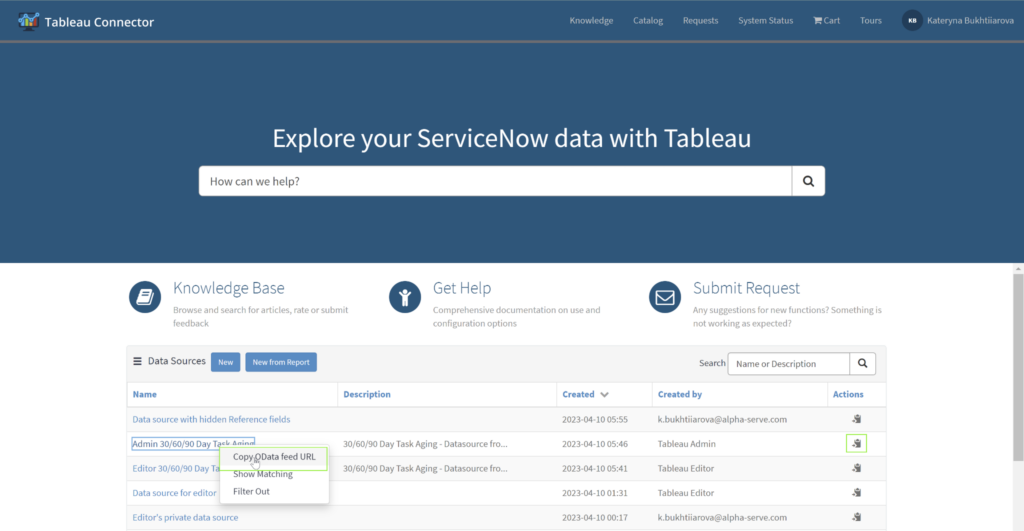
Depending on where you initially established the Data Source — either from the Service Portal or the Tableau Connector — locate the Data Sources table. Within this list, identify the Data Source you created during the previous step
Next, right-click on the Data Source and Copy OData feed URL or just click Copy icon.
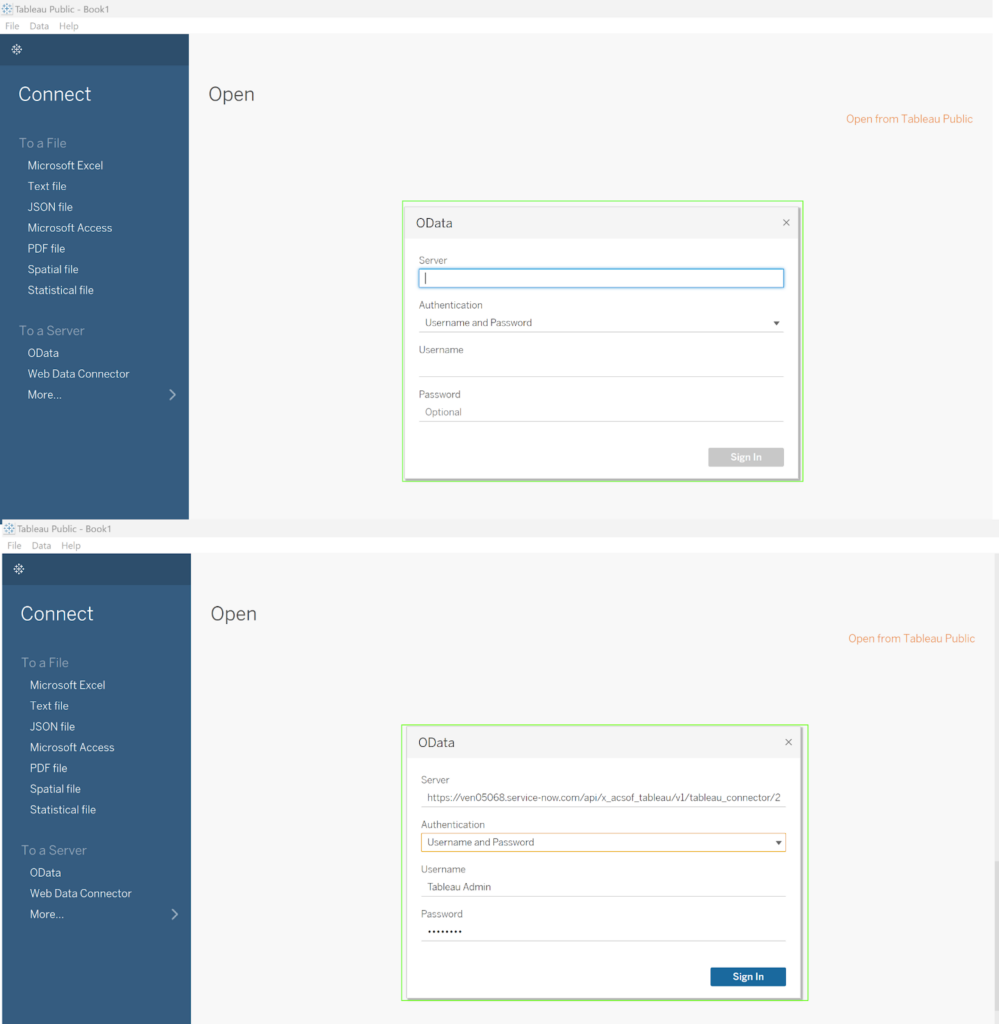
Select OData in the Tableau Desktop and enter the URL you copied earlier in the server field. Enter the login details to authenticate the data export and click Sign In.
The data importation process will begin as soon as this step is completed.
At this juncture, you have the capability to construct various visualizations utilizing your exported ServiceNow data within Tableau. Additionally, this data can be integrated with other data sources, thereby enabling you to compile comprehensive reports and intricate visualizations.
Conclusion
The integration of ServiceNow and Tableau through the Tableau Connector represents a strategic decision for businesses. It transforms data accessibility, manipulation, and visualization, thereby enhancing the operational efficiency and data-driven decision-making capabilities of an organization. The process of establishing Tableau ServiceNow integration, as detailed in this guide, is straightforward and devoid of complex technical prerequisites. With this integration, businesses can effectively analyze their ServiceNow data, create intricate visualizations, and develop comprehensive reports. Furthermore, this can be achieved by combining ServiceNow data with other data sources, thereby opening the door to more profound insights and strategic decisions.
It is our hope that this guide has not only illuminated the benefits and functionality of the Tableau ServiceNow Connector but also provided clear instructions on its setup and use. We encourage businesses to leverage this powerful tool, break down data silos, and fully utilize their data’s potential. Remember, in today’s data-driven world, the organization that best understands its data is the one most likely to succeed.


