Modern IT infrastructure requires robust monitoring solutions to ensure optimal performance, security, and availability. Open-source monitoring tools provide extensive functionality to monitor infrastructure components with significant customization capabilities. This comprehensive guide explores the best open source monitoring software for IT infrastructure in 2025, helping organizations choose the right solution for their specific needs.
What is Server Monitoring Software?
Server monitoring software is a specialized type of IT management tool designed to continuously track, analyze, and report on the performance, availability, and health of servers in an organization’s IT infrastructure. These applications provide real-time visibility into server operations, helping IT administrators proactively identify issues, optimize performance, and ensure system reliability.
Core Functionality
Server monitoring software operates by collecting and analyzing various metrics from servers including CPU utilization, memory usage, disk space, network traffic, and application performance. The software typically uses agents installed on target servers or agentless monitoring techniques like SNMP (Simple Network Management Protocol) to gather this data continuously.
The primary purpose is to provide early warning systems that alert administrators to potential problems before they impact business operations. This proactive approach helps prevent costly downtime and maintains optimal server performance across the infrastructure.
Key Components and Features
Performance Monitoring: Tracks essential server metrics such as processor usage, RAM consumption, disk I/O operations, and network bandwidth utilization. This data helps identify performance bottlenecks and capacity planning requirements.
Availability Monitoring: Continuously checks server uptime and service availability, immediately alerting administrators when systems become unreachable or services fail to respond.
Alerting and Notifications: Sophisticated alerting systems send notifications through various channels including email, SMS, mobile apps, or integration with IT service management platforms when predetermined thresholds are exceeded.
Historical Data Analysis: Stores performance data over time, enabling trend analysis, capacity planning, and identification of recurring issues or performance patterns.
Dashboard and Visualization: Provides intuitive graphical interfaces displaying real-time and historical data through charts, graphs, and customizable dashboards for quick assessment of server health.
Types of Server Monitoring
Agent-Based Monitoring: Requires software installation on each monitored server, providing detailed insights into system performance and application behavior. While offering comprehensive data collection, this approach requires maintenance of monitoring agents.
Agentless Monitoring: Uses network protocols like SNMP, WMI (Windows Management Instrumentation), or SSH to collect data without installing software on target servers. This approach simplifies deployment but may provide less detailed information.
Hybrid Monitoring: Combines both approaches, using agents for critical servers requiring detailed monitoring while employing agentless methods for basic infrastructure monitoring.
Benefits for Organizations
Server monitoring software provides significant value through improved system reliability, reduced downtime, and enhanced performance optimization. Organizations benefit from faster problem resolution, better resource utilization, and improved capacity planning capabilities.
The proactive nature of server monitoring helps prevent minor issues from escalating into major outages, protecting business continuity and customer satisfaction. Additionally, the historical data collected enables informed decision-making regarding infrastructure investments and optimization strategies.
Modern server monitoring solutions also support cloud environments, virtualized infrastructure, and containerized applications, adapting to evolving IT architectures and deployment models.
23 Open Source Server Monitoring Software
In this article you can find out below best Open Source Server Monitoring Software list below.
1. Zabbix – The Enterprise-Class Open Source Network Monitoring Solution
Zabbix is an enterprise-class, open-source monitoring solution that makes network and application monitoring simple. This powerful monitoring software for IT infrastructure offers comprehensive monitoring capabilities for networks, servers, applications, and services. Zabbix provides real-time monitoring with flexible alerting mechanisms and detailed reporting features.
The platform excels in scalability, supporting thousands of monitored devices through its distributed monitoring architecture. Its web-based interface offers intuitive dashboards and visualization tools, making it accessible for both technical and non-technical users. Zabbix supports multiple data collection methods including SNMP, agent-based monitoring, and agentless monitoring through SSH and Telnet.
Key Features:
- Auto-discovery of network devices and services
- Flexible trigger and alerting system
- Real-time graphing and custom dashboards
- Template-based configuration management
- Multi-tenant architecture support
- API for integration with third-party tools
Pros:
- Highly scalable for enterprise environments
- Comprehensive monitoring capabilities
- Strong community support and documentation
- Cost-effective compared to commercial solutions
Cons:
- Steep learning curve for beginners
- Resource-intensive for large deployments
- Limited mobile application functionality
2. Nagios – Open Source Monitoring and Network Management
Nagios is an open source IT infrastructure monitoring system originally designed for Linux that now runs on Unix variants and Windows, featuring a powerful monitoring engine with plugin support. This veteran monitoring software for IT infrastructure has been trusted by organizations worldwide for over two decades.
Nagios Core provides comprehensive monitoring of network services, host resources, and server metrics. The system conducts both active and passive checks, enabling proactive issue detection before problems impact business operations. Its plugin architecture allows extensive customization and integration with various systems and applications.
Key Features:
- Plugin-based architecture for extensibility
- Web-based configuration interface
- Escalation and notification systems
- Event handling and automatic remediation
- Performance data processing and graphing
- Multi-user access with role-based permissions
Pros:
- Mature and stable monitoring platform
- Extensive plugin ecosystem
- Strong community and commercial support
- Flexible configuration options
Cons:
- Configuration can be complex for large environments
- Limited built-in visualization capabilities
- Requires additional tools for advanced reporting
3. Prometheus – Monitoring system & time series database
Prometheus has become a go-to tool for time-series data monitoring in the DevOps world, offering pull-based metrics collection and PromQL query language. This cloud-native monitoring software specializes in collecting and storing time-series data with powerful querying capabilities.
Prometheus excels in containerized environments and Kubernetes deployments, providing native integration and service discovery. Its dimensional data model allows for flexible querying and alerting based on metric labels. The system’s pull-based architecture simplifies deployment and reduces network overhead compared to push-based systems.
Key Features:
- Time-series database with dimensional data model
- PromQL query language for flexible data analysis
- Service discovery for dynamic environments
- Built-in alerting manager integration
- HTTP pull model for data collection
- Kubernetes native integration
Pros:
- Excellent for cloud-native and containerized environments
- Powerful query language and alerting capabilities
- Strong integration with Grafana for visualization
- Active development and community support
Cons:
- Limited long-term data retention capabilities
- No built-in user authentication or authorization
- Steep learning curve for PromQL
4. Icinga – Open Source Monitoring for Complex IT Environments
Icinga adds context, health states, and intelligent alerts to monitoring environments, complementing metrics visualization tools. This modern monitoring software for IT infrastructure evolved from Nagios, offering enhanced features and improved user experience.
Icinga provides comprehensive monitoring of hosts, services, and network infrastructure with advanced visualization capabilities. The platform features a responsive web interface, powerful API, and flexible configuration management. Its modular architecture supports various data backends and visualization tools.
Key Features:
- Modern web interface with responsive design
- RESTful API for automation and integration
- Distributed monitoring capabilities
- Advanced notification and escalation systems
- Configuration management with version control
- Built-in graphing and reporting tools
Pros:
- User-friendly interface compared to traditional monitoring tools
- Strong API for automation and integration
- Active development with regular updates
- Good documentation and community support
Cons:
- Requires more resources than lightweight alternatives
- Configuration complexity for advanced setups
- Limited mobile application features
5. Cacti – RRDTool-based Graphing Solution
Cacti is a comprehensive network graphing solution designed to harness RRDTool’s data storage and graphing functionality. This monitoring software provides robust network monitoring capabilities with focus on performance data visualization and analysis.
The platform excels in SNMP-based monitoring, automatically polling network devices and generating detailed performance graphs. Cacti’s template system simplifies the addition of new devices and data sources, while its plugin architecture extends functionality for specialized monitoring requirements.
Key Features:
- RRDTool integration for data storage and graphing
- SNMP polling and data collection
- Template-based device management
- Plugin architecture for extensibility
- User management with granular permissions
- Automated graph generation and threshold monitoring
Pros:
- Excellent for network performance monitoring
- Strong graphing and visualization capabilities
- Well-established with proven reliability
- Good SNMP support and device templates
Cons:
- Limited alerting capabilities without plugins
- Primarily focused on network monitoring
- Interface appears dated compared to modern tools
6. Grafana
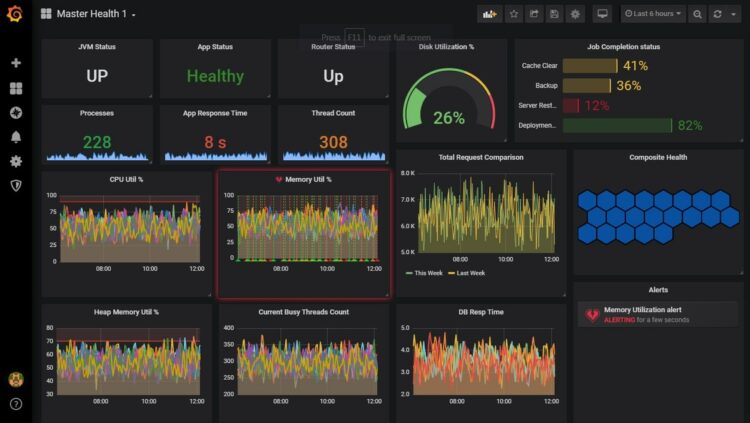
Grafana is a leading open source analytics and monitoring solution that transforms time-series data into meaningful visualizations. While primarily a visualization tool, Grafana has evolved into a comprehensive observability platform supporting multiple data sources and monitoring use cases.
The platform provides powerful dashboards with interactive visualizations, supporting data sources including Prometheus, InfluxDB, Elasticsearch, and many others. Grafana’s alerting system enables proactive monitoring with flexible notification channels and sophisticated alert rules.
Key Features:
- Multi-data source support and visualization
- Interactive dashboards with customizable panels
- Advanced alerting with multiple notification channels
- Plugin ecosystem for extended functionality
- Team collaboration and dashboard sharing
- Template variables for dynamic dashboards
Pros:
- Exceptional visualization capabilities
- Support for numerous data sources
- Active development and feature additions
- Strong community and enterprise support
Cons:
- Requires separate data collection tools
- Can become resource-intensive with complex dashboards
- Learning curve for advanced dashboard creation
7. Observium – Network monitoring with intuition
Observium is an autodiscovering network monitoring platform with a focus on providing beautiful and insightful network monitoring. This monitoring software for IT infrastructure automatically discovers network devices and generates comprehensive performance metrics and visualizations.
The platform provides detailed device information, interface statistics, and historical performance data through an intuitive web interface. Observium’s strength lies in its automatic device discovery and minimal configuration requirements, making it ideal for network-focused monitoring scenarios.
Key Features:
- Automatic network device discovery
- Comprehensive device support and MIB database
- Historical performance data and trending
- Clean and intuitive web interface
- Alerting system with multiple notification methods
- API access for integration and automation
Pros:
- Minimal configuration required for basic setup
- Excellent network device support
- Clean and professional interface
- Good performance with large network environments
Cons:
- Limited customization options in community edition
- Primarily focused on network monitoring
- Some advanced features require commercial license
8. Sensu
Sensu is a monitoring event pipeline that provides comprehensive infrastructure and application monitoring capabilities. This modern monitoring software focuses on monitoring as code principles, enabling scalable and maintainable monitoring configurations.
The platform provides flexible data collection, processing, and routing capabilities through its event-driven architecture. Sensu supports both traditional infrastructure monitoring and modern cloud-native environments with Kubernetes integration and dynamic service discovery.
Key Features:
- Event-driven monitoring architecture
- Monitoring as code with version control
- Dynamic service discovery and registration
- Flexible data processing and routing
- Multi-tenant deployment support
- Built-in metrics processing and storage
Pros:
- Modern architecture designed for scale
- Strong automation and integration capabilities
- Good documentation and community resources
- Suitable for both traditional and cloud-native environments
Cons:
- Requires more initial setup compared to traditional tools
- Learning curve for event-driven concepts
- Limited built-in visualization compared to comprehensive platforms
9. Checkmk – Infrastructure & Application Monitoring
Checkmk is a comprehensive monitoring solution that combines infrastructure monitoring, application monitoring, and log analysis in a single platform. This monitoring software for IT infrastructure provides both agent-based and agentless monitoring capabilities with intelligent alerting and reporting features.
The platform offers extensive monitoring coverage for networks, servers, applications, and cloud services. Checkmk’s strength lies in its automatic service discovery, comprehensive dashboards, and built-in business intelligence features that help organizations understand their IT infrastructure performance.
Key Features:
- Automatic service discovery and configuration
- Comprehensive monitoring coverage for hybrid environments
- Built-in business intelligence and reporting
- Distributed monitoring architecture
- API-driven configuration and automation
- Advanced alerting with intelligent grouping
Pros:
- Comprehensive monitoring capabilities in single platform
- Excellent automation and discovery features
- Good scalability and performance
- Strong documentation and support resources
Cons:
- Can be complex to configure for specific requirements
- Resource requirements increase with monitored infrastructure size
- Some features limited in community edition
10. LibreNMS
LibreNMS is a fully featured network monitoring system that provides comprehensive network discovery, monitoring, and alerting capabilities. This monitoring software automatically discovers network devices and provides detailed performance metrics, fault detection, and capacity planning features.
The platform excels in network device support with extensive MIB database and automatic polling configurations. LibreNMS provides horizontal scaling capabilities and supports multiple authentication methods, making it suitable for various organizational requirements.
Key Features:
- Automatic network discovery and device polling
- Comprehensive device support with extensive MIB database
- Horizontal scaling and distributed polling
- Advanced alerting with multiple notification channels
- API access for integration and automation
- Multiple authentication backend support
Pros:
- Excellent network device discovery and support
- Strong community development and contributions
- Good scalability for large network environments
- Comprehensive documentation and setup guides
Cons:
- Primarily focused on network monitoring
- Limited application monitoring capabilities
- Interface customization options are limited
11. Netdata – Real-Time Monitoring For Infrastructure & Apps
Netdata is a real-time performance monitoring solution that provides instant visibility into system metrics with minimal resource overhead. This monitoring software specializes in high-resolution monitoring with interactive visualizations and zero-configuration deployment.
The platform provides comprehensive system monitoring including CPU, memory, disk, network, and application metrics. Netdata’s distributed architecture enables monitoring of complex infrastructures while maintaining low resource consumption and providing real-time insights.
Key Features:
- Real-time monitoring with minimal overhead
- Zero-configuration auto-detection of services
- Interactive web dashboards with real-time updates
- Distributed monitoring architecture
- Machine learning-powered anomaly detection
- Custom dashboards and alert configuration
Pros:
- Extremely easy to deploy and configure
- Real-time monitoring with excellent performance
- Beautiful and responsive web interface
- Low resource consumption
Cons:
- Limited long-term data retention in default configuration
- Fewer traditional enterprise monitoring features
- Alert configuration can be complex for advanced scenarios
12. Graphite
Graphite is a time-series data storage and graphing system designed for storing numeric time-series data and rendering graphs on demand. This monitoring software provides reliable data storage with flexible graphing capabilities for infrastructure and application metrics.
The platform consists of three main components: Carbon for data collection, Whisper for data storage, and the Graphite web application for visualization. Graphite’s strength lies in its simplicity and reliability for storing and visualizing time-series data from various sources.
Key Features:
- Time-series data storage with configurable retention policies
- Flexible graphing and visualization capabilities
- Simple HTTP-based API for data submission
- Clustering support for high availability
- Plugin architecture for data collection
- Integration with various monitoring tools
Pros:
- Reliable and proven time-series storage
- Simple API for data submission and retrieval
- Good performance with proper configuration
- Strong integration capabilities
Cons:
- Limited built-in alerting capabilities
- Interface appears dated compared to modern tools
- Requires additional tools for comprehensive monitoring
13. Monit
Monit is a small utility for managing and monitoring Unix systems, processes, programs, files, directories, and filesystems. This lightweight monitoring software provides automatic maintenance and repair capabilities with simple configuration and minimal resource requirements.
The platform excels in process monitoring and automatic recovery actions, making it ideal for ensuring critical services remain operational. Monit’s embedded web server provides status monitoring and control capabilities through a clean web interface.
Key Features:
- Process and service monitoring with automatic recovery
- File, directory, and filesystem monitoring
- Network service monitoring and testing
- Embedded web server for status and control
- Email and custom alerting capabilities
- Simple configuration with readable syntax
Pros:
- Lightweight with minimal resource requirements
- Simple configuration and deployment
- Automatic recovery and remediation capabilities
- Good documentation and examples
Cons:
- Limited to basic monitoring scenarios
- No advanced visualization or reporting features
- Not suitable for large-scale enterprise monitoring
14. Munin
Munin is a networked resource monitoring tool that helps analyze resource trends and performance bottlenecks. This monitoring software provides excellent trending and capacity planning capabilities through its plugin-based architecture and automatic graph generation.
The platform uses a master-slave architecture where the master polls slaves for data and generates comprehensive graphs and reports. Munin’s strength lies in its simplicity and focus on trending analysis rather than real-time alerting.
Key Features:
- Plugin-based data collection architecture
- Automatic graph generation and trending
- Master-slave distributed monitoring
- Web-based reporting and visualization
- Capacity planning and trend analysis
- Simple configuration and plugin development
Pros:
- Excellent for trend analysis and capacity planning
- Simple setup and configuration
- Good plugin ecosystem and extensibility
- Reliable long-term data collection
Cons:
- Limited real-time monitoring capabilities
- Basic alerting functionality
- Not suitable for immediate problem detection
15. OpenNMS
OpenNMS is an enterprise-grade network monitoring and management platform designed for building comprehensive monitoring solutions. This monitoring software for IT infrastructure provides fault management, performance measurement, and service assurance capabilities for complex network environments.
The platform offers both fault monitoring and performance data collection with advanced correlation and root cause analysis capabilities. OpenNMS supports large-scale deployments with distributed architecture and provides comprehensive APIs for integration and customization.
Key Features:
- Comprehensive fault and performance monitoring
- Event correlation and root cause analysis
- Distributed monitoring architecture
- Service level monitoring and reporting
- Comprehensive device support and provisioning
- Advanced notification and escalation systems
Pros:
- Enterprise-grade scalability and reliability
- Comprehensive monitoring capabilities
- Strong community and commercial support
- Good integration and customization options
Cons:
- Complex setup and configuration
- Steep learning curve for advanced features
- Resource-intensive for smaller environments
16. Pandora FMS
Pandora FMS is a comprehensive monitoring solution that provides network monitoring, server monitoring, application monitoring, and log analysis capabilities. This monitoring software offers both agent-based and agentless monitoring with advanced visualization and reporting features.
The platform provides complete infrastructure visibility with automated discovery, flexible alerting, and business service monitoring. Pandora FMS supports various deployment models including on-premises, cloud, and hybrid environments.
Key Features:
- Comprehensive monitoring coverage for hybrid environments
- Automated discovery and provisioning
- Business service monitoring and SLA reporting
- Advanced visualization and custom dashboards
- Log analysis and correlation capabilities
- Multi-tenant architecture support
Pros:
- Comprehensive feature set in single platform
- Good scalability and deployment flexibility
- Strong visualization and reporting capabilities
- Active development and feature additions
Cons:
- Can be complex to configure for specific requirements
- Resource requirements for full feature utilization
- Some advanced features require commercial licensing
17. Zenoss
Zenoss is an IT monitoring and analytics platform that provides comprehensive infrastructure monitoring with advanced analytics and machine learning capabilities. This monitoring software focuses on providing actionable insights through intelligent data analysis and automated problem resolution.
The platform offers hybrid cloud monitoring with support for traditional infrastructure, virtualized environments, and cloud services. Zenoss provides advanced analytics capabilities including anomaly detection, capacity planning, and performance optimization recommendations.
Key Features:
- Hybrid cloud and infrastructure monitoring
- Machine learning-powered analytics and insights
- Automated discovery and configuration
- Advanced visualization and custom dashboards
- Integration with ITSM and automation tools
- Comprehensive API for customization
Pros:
- Advanced analytics and machine learning capabilities
- Comprehensive monitoring coverage
- Good scalability and enterprise features
- Strong integration capabilities
Cons:
- Complex setup and administration
- Resource-intensive deployment requirements
- Limited community edition features
18. Monitorix
Monitorix is a free, open source, lightweight system monitoring tool designed to monitor as many services and system resources as possible. This monitoring software provides comprehensive system monitoring with focus on historical data collection and trending analysis.
The platform offers built-in web server for data visualization and supports various operating systems including Linux, FreeBSD, OpenBSD, and NetBSD. Monitorix provides detailed system metrics including CPU usage, memory consumption, disk activity, network traffic, and various system services.
Key Features:
- Comprehensive system resource monitoring
- Built-in web server for data visualization
- Multiple operating system support
- Detailed historical data collection
- Email alerting and notification capabilities
- Configuration-free operation for basic monitoring
Pros:
- Lightweight with minimal resource requirements
- Comprehensive system monitoring coverage
- Simple setup and configuration
- Good historical data analysis capabilities
Cons:
- Limited customization options
- Basic alerting and notification features
- Not suitable for enterprise-scale monitoring
19. Riemann
Riemann is a distributed system for monitoring and alerting that aggregates events from servers and applications with powerful stream processing capabilities. This monitoring software specializes in real-time event processing and complex event correlation.
The platform provides flexible event routing and processing through its Clojure-based configuration, enabling sophisticated monitoring workflows and automated responses. Riemann excels in environments requiring complex event correlation and real-time decision making.
Key Features:
- Real-time event stream processing
- Flexible event routing and correlation
- Clojure-based configuration and extensibility
- Built-in mathematical functions and operations
- Multiple output destinations and integrations
- Distributed architecture for scalability
Pros:
- Powerful event processing and correlation capabilities
- Flexible configuration and customization
- Good performance for high-volume event streams
- Strong integration capabilities
Cons:
- Steep learning curve for Clojure configuration
- Limited built-in visualization capabilities
- Requires technical expertise for advanced configurations
20. Collectd
Collectd is a daemon which collects system performance statistics periodically and provides mechanisms to store the values. This monitoring software focuses on efficient data collection with minimal system impact and extensive plugin support.
The platform provides comprehensive system and application metrics collection with support for various storage backends and output formats. Collectd’s modular architecture enables selective monitoring of specific metrics while maintaining low resource consumption.
Key Features:
- Efficient data collection with minimal overhead
- Extensive plugin ecosystem for various metrics
- Multiple storage backend support
- Network-based data transmission
- Threshold monitoring and alerting
- Flexible configuration and customization
Pros:
- Very low resource consumption
- Extensive plugin support and flexibility
- Good performance for large-scale deployments
- Simple configuration for basic scenarios
Cons:
- Limited built-in visualization capabilities
- Requires additional tools for comprehensive monitoring
- Command-line focused configuration
21. Telegraf
Telegraf is a plugin-driven server agent for collecting and sending metrics and events from databases, systems, and IoT sensors. This monitoring software provides comprehensive data collection capabilities with extensive input and output plugin support.
The platform serves as a universal data collector that can gather metrics from various sources and forward them to multiple destinations. Telegraf’s plugin architecture enables monitoring of diverse systems and applications with minimal configuration complexity.
Key Features:
- Plugin-driven architecture for extensive integration
- Support for multiple input and output formats
- Comprehensive system and application metrics collection
- Low resource consumption and high performance
- Configuration through simple TOML files
- Built-in data processing and transformation capabilities
Pros:
- Extensive plugin ecosystem and integration options
- Simple configuration and deployment
- Good performance and scalability
- Active development and community support
Cons:
- Requires separate visualization and alerting tools
- Limited built-in processing capabilities
- Configuration can become complex with many plugins
22. Kapacitor
Kapacitor is a real-time streaming data processing engine that provides alerting, anomaly detection, and data processing capabilities for time-series data. This monitoring software specializes in stream processing and automated response to monitoring data.
The platform processes streaming data from InfluxDB and other sources, enabling real-time alerting and automated responses to monitoring events. Kapacitor’s strength lies in its ability to perform complex data analysis and automated actions based on streaming metrics.
Key Features:
- Real-time stream processing for time-series data
- Flexible alerting with custom logic and conditions
- Built-in anomaly detection capabilities
- Data transformation and processing functions
- Integration with various notification systems
- Scalable distributed processing architecture
Pros:
- Powerful stream processing capabilities
- Flexible alerting and automation features
- Good integration with InfluxDB ecosystem
- Scalable architecture for high-volume data
Cons:
- Requires additional tools for data collection and visualization
- Complex configuration for advanced processing
- Limited to time-series data processing
23. StatsD
StatsD is a network daemon that listens for statistics sent over UDP or TCP and sends aggregates to one or more pluggable backend services. This monitoring software provides simple and efficient application metrics collection with minimal performance impact.
The platform serves as a metrics aggregation layer that collects custom application metrics and forwards them to various monitoring systems. StatsD’s simplicity and low overhead make it ideal for application performance monitoring and custom metric collection.
Key Features:
- Simple UDP/TCP-based metrics collection
- Built-in metric aggregation and processing
- Multiple backend support for data forwarding
- Minimal performance impact on applications
- Support for various metric types (counters, timers, gauges)
- Flexible configuration and plugin support
Pros:
- Very simple integration for application metrics
- Minimal performance overhead
- Flexible backend integration options
- Good for custom application monitoring
Cons:
- Limited to application metrics collection
- Requires additional tools for visualization and alerting
- Basic functionality compared to comprehensive monitoring platforms
Conclusion
The landscape of open source monitoring software for IT infrastructure in 2025 offers diverse solutions catering to various organizational needs and technical requirements. Each tool has its strengths, with solutions like Prometheus and Grafana excelling in cloud-native environments, while traditional tools like Zabbix and Nagios provide comprehensive enterprise monitoring capabilities.
When selecting monitoring software for IT infrastructure, organizations should consider factors such as scalability requirements, deployment complexity, visualization needs, and integration capabilities. Modern cloud-native environments benefit from tools like Prometheus and Grafana, which provide excellent Kubernetes integration and container monitoring capabilities. Traditional enterprises may prefer comprehensive platforms like Zabbix or OpenNMS that offer extensive device support and mature feature sets.
The key to successful infrastructure monitoring lies in choosing tools that align with organizational requirements and technical expertise. Many organizations adopt hybrid approaches, combining multiple tools to create comprehensive monitoring solutions. For example, using Prometheus for metrics collection, Grafana for visualization, and traditional tools like Nagios for specific monitoring scenarios.
The open source monitoring ecosystem continues to evolve rapidly, with increasing focus on cloud-native architectures, machine learning-powered analytics, and automated response capabilities. Organizations should evaluate their current monitoring needs while considering future scalability and integration requirements. The tools presented in this guide represent proven solutions that can provide effective monitoring for various IT infrastructure scenarios, from small deployments to large enterprise environments.
Successful monitoring implementation requires not only selecting appropriate tools but also developing proper monitoring strategies, establishing meaningful metrics, and creating effective alerting mechanisms. The investment in robust monitoring software for IT infrastructure pays dividends through improved system reliability, faster problem resolution, and better capacity planning capabilities.